From Localhost to Production: Deploying Your Web App to the Internet Small to Medium Scale Web Apps
- Chapi Menge
- Programming
- September 30, 2024
Do you want to deploy your web app and don’t know where to start? Well Today will be the last day you will be stuck in localhost.
Table of Contents
Introduction
Hey Everyone, It has been a while since i wrote a blog. Today I wanted to share with you guys a blog that many beginner developers wanted to know about which is deploying your app to the internet and orchestrating with CI/CD.
“You’ve Built It, Now Let’s Deploy It”
i assume your application is ready and everything is working fine on your local machine. So now you want to deploy your application to the internet.
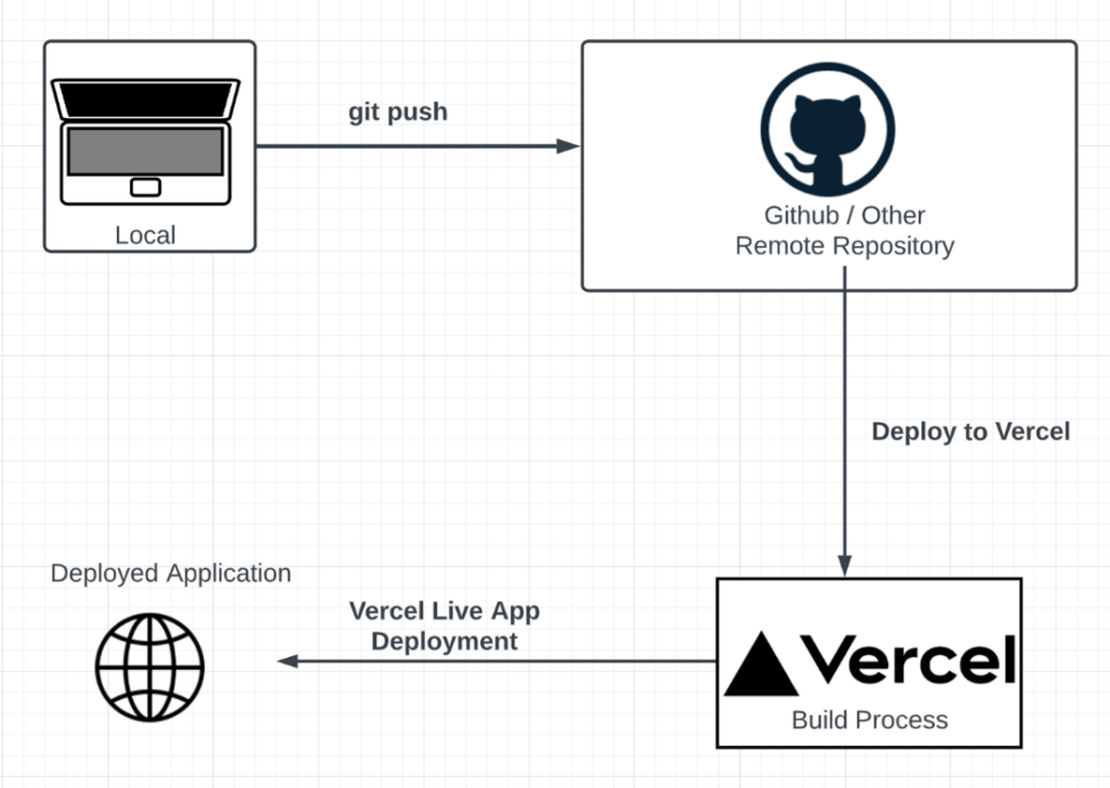
What is Deployment?
Simply put, deployment is the process of making your application available to the users. It involves moving your application from your local machine to a server that is accessible to the internet. But of course, it’s not that simple. There are a lot of things to consider when deploying your application.
Let’s start by asking couple of simple questions,
- Are you using Version Control(Git) for your project? and do you have a repository on Github, Gitlab or Bitbucket or any repo hub?
if not, you should start using version control and create a repository for your project.
- Are you sure you have ignored unnecessary files in your repository? like
.envfiles,node_modules,env/etc.
if not, you should add them to your
.gitignorefile, so that it won’t be pushed to your repository.
- Do you have hard coded values in your code? like
localhost:3000or database connection strings?
if yes, you should move them to environment variables so that you can easily change them when you deploy your application.
- Do you have a database? if yes, do you need to backup your database?
if yes, you should have a backup strategy for your database. if you are using a managed database, they usually have a backup feature so you can use that. if you are not using managed database make sure you have a backup strategy.
- Does your app have system dependencies? like
ffmpeg,imagemagick,wkhtmltopdfetc.
if yes, either you should install them manually on your server or use docker to containerize your app(recommended to use docker).
i mean we can ask a lot of questions but let’s move on before you get bored.
The first thing we should do is to choose a cloud service provider to host our application. There are a lot of cloud service providers out there, but we will choose one for now. We will also choose a CI/CD service to automate our deployment process.
For this example and for most people simplicity we will use Github Actions for CI/CD(either self-hosted or Github hosted) and we will use a cloud compute service to host our app.
Once you have provisioned your server, make sure to configure ssh access to your server and add your ssh key to your server. Read this blog
Create a CI/CD Pipeline with Github Actions
Github Actions is a CI/CD service provided by Github. It allows you to automate your workflow by creating actions that are triggered by events like push, pull request, etc.
So there is two ways to deploy your app using Github Actions, either you can use the Github hosted runners or you can use self-hosted runners.
Github Hosted Runners are free to use but they have some limitations which you can check here . Github Hosted Runner will only run on Github servers and to deploy your app you gotta find a way to connect to your server from the Github Hosted Runner(which is totally possible specially over ssh).
Self-Hosted Runners are runners that you host yourself. You can use your own hardware or you can use a cloud service to host your runner. Self-Hosted Runners are more flexible and you can install any software you want on them. You can also use them to deploy your app to your server. The only downside is that you have to manage the runner yourself but for simple deployment it is actually so easy because mostly the application server and the runner server are the same.
For this example, we will use Self Hosted Runner to deploy our app. We will create a simple workflow that will build our app, run tests and deploy our app to our server.
Our workflow will have
- Test Our App
- Build Our App
- Deploy Our App using Docker compose
- Notify Us if the deployment is successful or not
Here is the workflow file that we will use to deploy our app.
name: Deploy App

on:
  push:
    branches:
      - main

jobs:
  build:
    runs-on: self-hosted
    steps:
      - name: Checkout code
        uses: actions/checkout@v4

      # if you are not using NodeJs change the testing command to your desired command
      - name: Test
        run: npm test

      # if you are not using NodeJs change the build command to your desired command
      - name: Build
        run: npm run build

      # The below steps are kind of generic and you can use them for any kind of app
      # and of course you can customize them to fit your needs
      - name: Copy code to target directory
        run: |
          # Define the directory where your app will be deployed
          TARGET_DIR=/path/to/your/app
          # Create the directory if it doesn't exist
          mkdir -p $TARGET_DIR
          # Copy all built files to the target directory
          cp -R ./ $TARGET_DIR

      # if you are not using Docker change the deploy command to your desired command
      - name: Deploy
        working-directory: /path/to/your/app
        run: |
          # put the necessary commands to deploy your app here
          docker compose down
          sleep 5 # optional but recommended to wait for the containers to stop gracefully
          docker compose up -d --build # the --build flag is optional but recommended to build the images before starting the containers

      - name: Notify
        run: echo "Deployment Successful"
So the above code is the most basic workflow that you can use to deploy your app to your server using Github Actions. You can customize it to fit your needs.
Before moving on please follow this steps to install and configure a self-hosted runner on your server.
One thing most of us forget to do is to make the runner start as a service so that it will start automatically when the server restarts. You can follow this guide to make the runner start as a service.
Configuring Monitoring and Logging
One of the most important things most beginners forget to do is to configure monitoring and logging for their app. Monitoring and logging are important because they help you to know what is happening with your app. You can use monitoring and logging to know if your app is working fine or if there are any issues with your app.
Monitoring keeps you informed about the health, performance, key metrics, and potential issues of your app. Specially when your app is new to production, monitoring is very important because you don’t know how your app will behave in production.
For monitoring, I really suggest you to use tools like Graphana , and Prometheus for starters. They are easy to use and they have a lot of features that will help you to monitor your app.
For Logging, My favorite tools is Grafana Loki . It is a log aggregation tool that is easy to use and it has a lot of features that will help you to log your app. There are a lot of supported storage options when your app grows and you store a lot of logs like
- Amazon Simple Storage Storage (S3)
- Google Cloud Storage (GCS)
- Microsoft Azure Blob Storage
- IBM Cloud Object Storage (COS)
- Baidu Object Storage (BOS)
- Alibaba Object Storage Service (OSS) and a bit more.
Lets set up monitoring and logging for our app using Grafana, Prometheus and Loki.
I will assume you use a very simple fastapi app for this example.
import logging
import time
from fastapi import FastAPI
from prometheus_client import Counter, Histogram, generate_latest, CONTENT_TYPE_LATEST
# I really suggest building a custom logger for your app with
# coloring, formatting, filtering, etc. but for this example we will use the default logger
logger = logging.getLogger(__name__)
logger.setLevel(logging.INFO)

# set up the prometheus metrics
REQUESTS = Counter('http_requests_total', 'Total HTTP Requests (count)', ['method', 'endpoint', 'status'])
DURATION = Histogram('http_request_duration_seconds', 'HTTP Request Duration (seconds)', ['method', 'endpoint', 'status'])


app = FastAPI()


# middleware to record the metrics
@app.middleware("http")
async def record_metrics(request, call_next):
  try:
    start_time = time.time()
    response = await call_next(request)
    duration = time.time() - start_time
    REQUESTS.labels(request.method, request.url.path, response.status_code).inc()
    DURATION.labels(request.method, request.url.path, response.status_code).observe(duration)
    return response
  except Exception as e:
    duration = time.time() - start_time # most probably you won't need latency for 500 errors but it is good to have it
    REQUESTS.labels(request.method, request.url.path, 500).inc()
    DURATION.labels(request.method, request.url.path, 500).observe(duration)
    return JSONResponse(status_code=500, content={"message": "Internal Server Error"})

@app.get("/")
async def read_root():
  logger.info("Hello World")
  logger.error("This is an error")
  return {"Hello": "World"}

@app.get("/metrics")
async def metrics():
  # make sure to protect this endpoint with some kind of authentication
  # for exmaple
  # sender_ip = request.client.host
  # if sender_ip != ALLOWED_IP:
  #  return JSONResponse(status_code=403, content={"message": "Forbidden"})
  # or admins only can access this endpoint
  return Response(content=generate_latest(), media_type=CONTENT_TYPE_LATEST)
So the above code is a simple FastAPI app that has a middleware to record the metrics and a simple endpoint that returns a json response. We also have a logger that logs an info message and an error message.
Are you asking me why i didn’t use file based logging? So let me answer that even though you didn’t ask me 😂, so i usually wanted to log to console and from there i can redirect logs to file if i wanted to so managing file based logging inside my app is a bit time consuming task and i wanted to manage it outside of the app.
Let me explain a bit about how prometheus and loki works.
Prometheus is a monitoring tool that collects metrics from your app like we used about Counter and Histogram to get the number of request we received(Counter) and the duration of the request(Histogram). Prometheus works in a pull model, it scrapes the metrics from your app at regular intervals which means your app collects the metrics and it will store them in memory until Prometheus scrapes them. So We will run a Prometheus server that will scrape the metrics from our app.

Grafana Loki is a set of open source components that can be composed into a fully featured logging stack. A small index and highly compressed chunks simplifies the operation and significantly lowers the cost of Loki(Taken from the docs ). Loki works in a push model, your app pushes the logs to Loki. So we will run a Loki server that will receive the logs from our app. But in our case we can leverage the Docker logging driver to push the logs to Loki. i will show you how in below.

Now let’s setup Grafana, Prometheus and Loki to monitor and log our app.
Let’s start with prometheus config file.
prometheus.yml
global:
  scrape_interval: 15s

scrape_configs:
  - job_name: 'app'
    static_configs:
      - targets: ['localhost:8000']
    metrics_path: /metrics
    # scrape_interval: 30s if you wanted to change the scrape interval for this app
  # below is optional remove it if you don't have any other app to monitor
  # but if you have background jobs(celery, cron jobs, etc) you can add them here
  - job_name: 'any-other-app'
    static_configs:
      - targets: ['localhost:8001']
    metrics_path: /metrics # make sure to change the metrics path if you have a different path
You can also have a grafana loki config file but for this example we will use the default config file. READ MORE
Here is a simple nginx config file to serve our app and to proxy the metrics endpoint to our app.
nginx.conf
server {
  listen 80;
  server_name your-domain.com; # or use your server ip like 54.242.x.x or domain like example.com

  location / {
    proxy_pass http://localhost:8000;
    proxy_set_header Host $host;
    proxy_set_header X-Real-IP $remote_addr;
    proxy_set_header X-Forwarded-For $proxy_add_x_forwarded_for;
    proxy_set_header X-Forwarded-Proto $scheme;
  }
}
So lets go straight to the docker-compose file for adding everything together.
x-logging: &default-logging
  driver: loki
  options:
    loki-url: "http://loki:3100/loki/api/v1/push"
    loki-external-labels: "container_name=prod-{{.Name}}" # you can customize the external labels to fit your needs
    env: production
    # please read about the options in the docs https://grafana.com/docs/loki/latest/send-data/docker-driver/configuration/
    loki-pipeline-stages: |
      - multiline:
          firstline: '^\d{4}-\d{2}-\d{2} \d{1,2}:\d{2}:\d{2}'
          max_wait_time: 3s
      - regex:
          expression: '^(?P<time>\d{4}-\d{2}-\d{2} \d{1,2}:\d{2}:\d{2},d{3}) (?P<message>(?s:.*))$$'

services:
  app:
    ...
    logging: *default-logging

  any-other-service:
    ...
    logging: *default-logging

  nginx:
    image: nginx
    ports:
      - "80:80"
    volumes:
      - ./nginx.conf:/etc/nginx/nginx.conf
    depends_on:
      - app
    # you don't need to log nginx logs but if you want to log them you can uncomment below line
    # logging: *default-logging

  prometheus:
    image: prom/prometheus
    ports:
      - "9090:9090"
    volumes:
      - ./prometheus.yml:/etc/prometheus/prometheus.yml
      - prometheus-data:/prometheus
    command: --config.file=/etc/prometheus/prometheus.yml
    depends_on:
      - app

  grafana:
    image: grafana/grafana
    ports:
      - "3000:3000"
    depends_on:
      - prometheus
    volume:
      - grafana-data:/var/lib/grafana
    environment:
      - GF_SECURITY_ADMIN_USER=admin
      - GF_SECURITY_ADMIN_PASSWORD=admin
      - GF_USERS_ALLOW_SIGN_UP=false # you can allow sign up if you want but it is not recommended

  loki:
    image: grafana/loki
    ports:
      - "3100:3100"
    # if you have a config file for loki you can mount it here
    # options like auth, storage and many more can be configured in the config file
    volumes:
      - loki-data:/loki
    #   - ./loki-config.yml:/etc/loki/local-config.yaml
    command: -config.file=/etc/loki/local-config.yaml
    depends_on:
      - app

volumes:
  prometheus-data:
  grafana-data:
  loki-data:
Info
The above code might not work on the first go depending on your app and your setup. You might need to customize it to fit your needs.
So after all the above steps you should have a fully working monitoring and logging setup for your app. You can now monitor your app and log your app.
Deploy the app and allow the following ports in your firewall to access the services 3000, 9090, 3100.
Now head over to http://your-server-ip:3000 and login with the credentials you set in the docker-compose file. First time login of Grafana will be admin and admin and it will prompt you to change the password.
So Grafana is like a central dashboard for a lot of things like monitoring, logging, alerting, etc. You can create dashboards to monitor your app and you can create alerts to alert you if something goes wrong with your app.
To add Prometheus and Grafana loki to the grafana dashboard follow the below steps.
- From the Side bar click on
Connectionsand clickAdd data connections

- Search for
Prometheus/Lokiand clickAdd new data source. When you add source url make sure to use docker container name as the host name likehttp://prometheus:9090orhttp://loki:3100and clickSave & Test.

Same goes for Loki data source.
Tip
if you are not using docker you can use the server ip or domain name as the host name or even localhost if you are running the services on the same machine. When your app grows you usually server monitoring server alone and you will start using server ip or custom domain name for it.
Now you can go to Explore page and start querying and look at your log or your metrics.
To understand more how to use the Grafana and Prometheus and Loki please read the docs and watch a quick tutorial on youtube.
Grafana have a huge collection of dashboards you can use and most of them are free. Here is a link to the dashboards. You will be surprised to find how many crucial dashboards are available for free. Thank me later 😂.
Conclusion
For sure deployments are not this simple but i tried to make it as simple as possible. There are a lot of things to consider when deploying your app like security, performance, scalability, etc. But for a beginner this is a good start.
From Security standpoint, restricting your applications accesses, configuring nginx or apache to serve your app, setting up firewalls, etc are some of the things you should consider.
From Performance standpoint, caching, load balancing, etc are some of the things you should consider.
From Scalability standpoint, horizontal scaling, vertical scaling, etc are some of the things you should consider.
A lot of stuff are meant to be done but when you start, you start from the basics and you build on top of that. Specially you add things when you need them. Don’t over engineer your app. Keep it simple and build on top of that.
I hope this blog was helpful to you. If you have any questions or suggestions please let me know in the comments.
Thank you for reading.
Info
The above video is a joke 😂 for you to smile after all the reading.
Happy Hacking
Chapi Menge